Predefined Types
Qlar ships with six predefined analysis types, ready to use on every agent without any setup. Together they cover the most common dimensions of conversation quality and risk — complaints, resolution, sentiment, topics, unanswered questions, and risk signals — so you can start analyzing conversations before you've defined a single type of your own.
Predefined types are maintained by the Qlar team and are read-only: you can view every setting, use them in runs, and duplicate them, but you cannot edit the original. This keeps a stable baseline available to every agent. If your definition of "complaint" or "risk" differs from the default, duplicate the type and adjust the copy instead — the original stays untouched for everyone else.
Finding Predefined Types in the UI
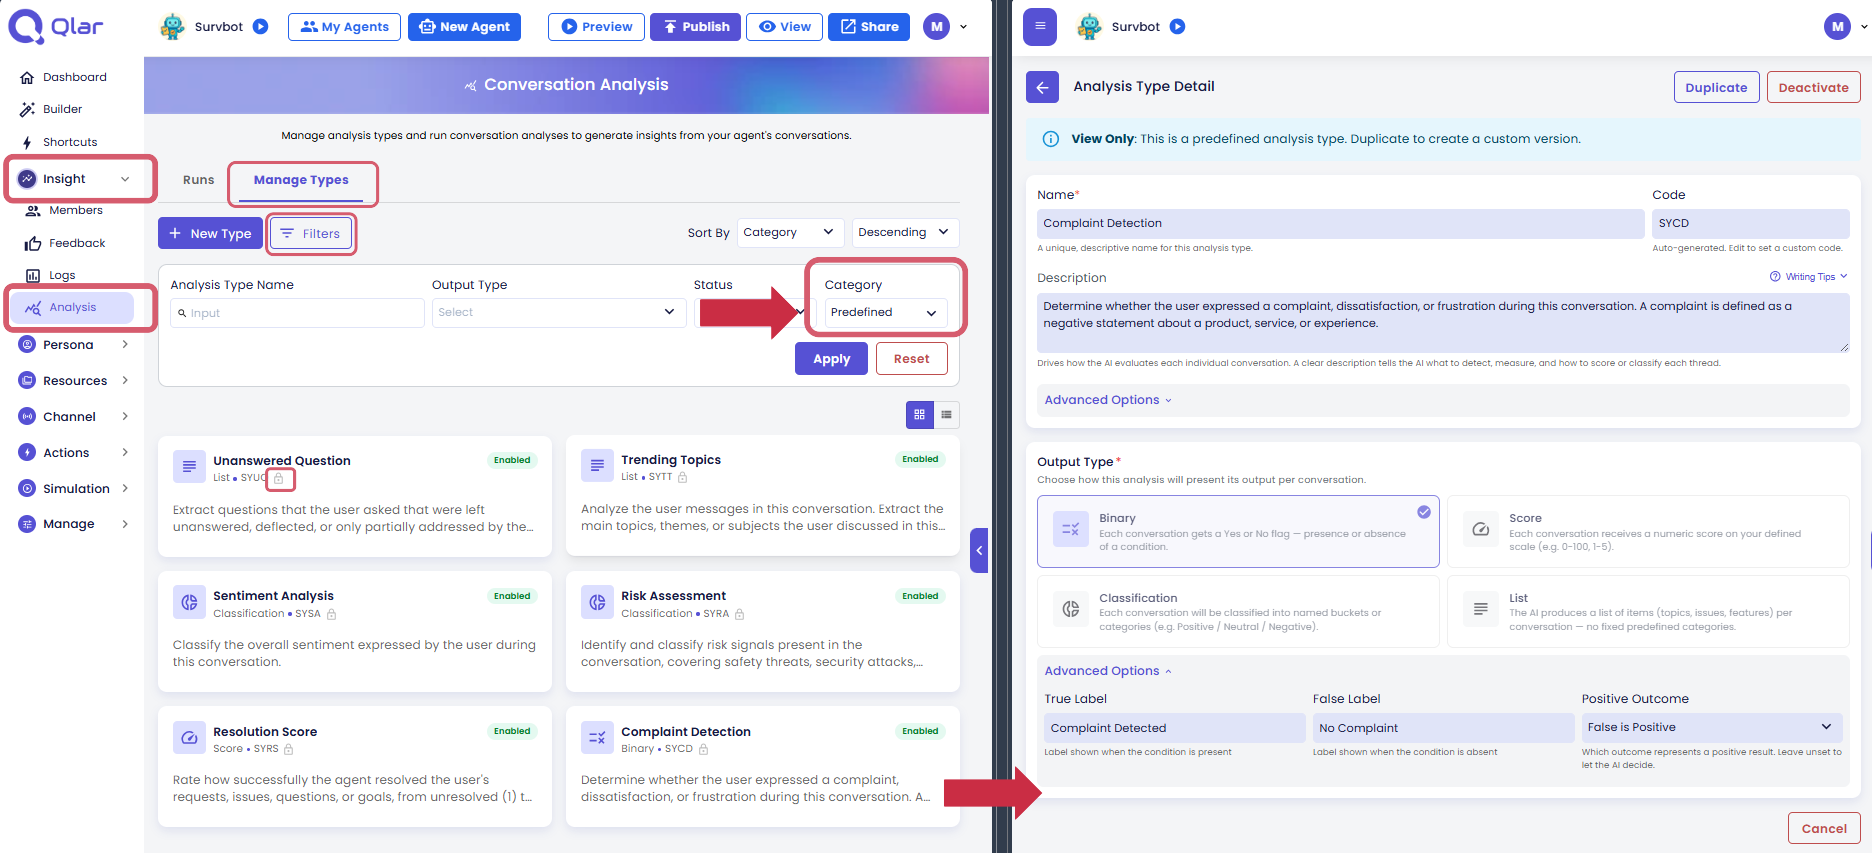
Predefined and custom types live together in the same Manage Types list, so it helps to know how to tell them apart and jump straight to the ones you didn't create yourself.
- Go to Analytics → Analysis, then open the Manage Types tab.
- Click Filters to expand the filter panel.
- Set the Category filter to Predefined and click Apply — the list now shows only the six types described on this page.
- Every predefined type displays a lock icon 🔒 next to its 4-letter code, both in grid and list view. Custom types never show this icon, so it's the fastest way to tell them apart even without filtering.
Click any predefined type to open its detail page. Because it's read-only, the page opens directly in View Only mode — a banner at the top says so, and the header only offers Duplicate and Deactivate (there's no Save, since there's nothing you're allowed to change). Every section is still there to inspect: Name, Code, Description, the Output Type configuration (labels, categories, or score range depending on the type), and Advanced Options. Opening a predefined type this way is the quickest way to understand exactly what it measures and how it's configured before you use it in a run or duplicate it into a custom type.
1. Complaint Detection
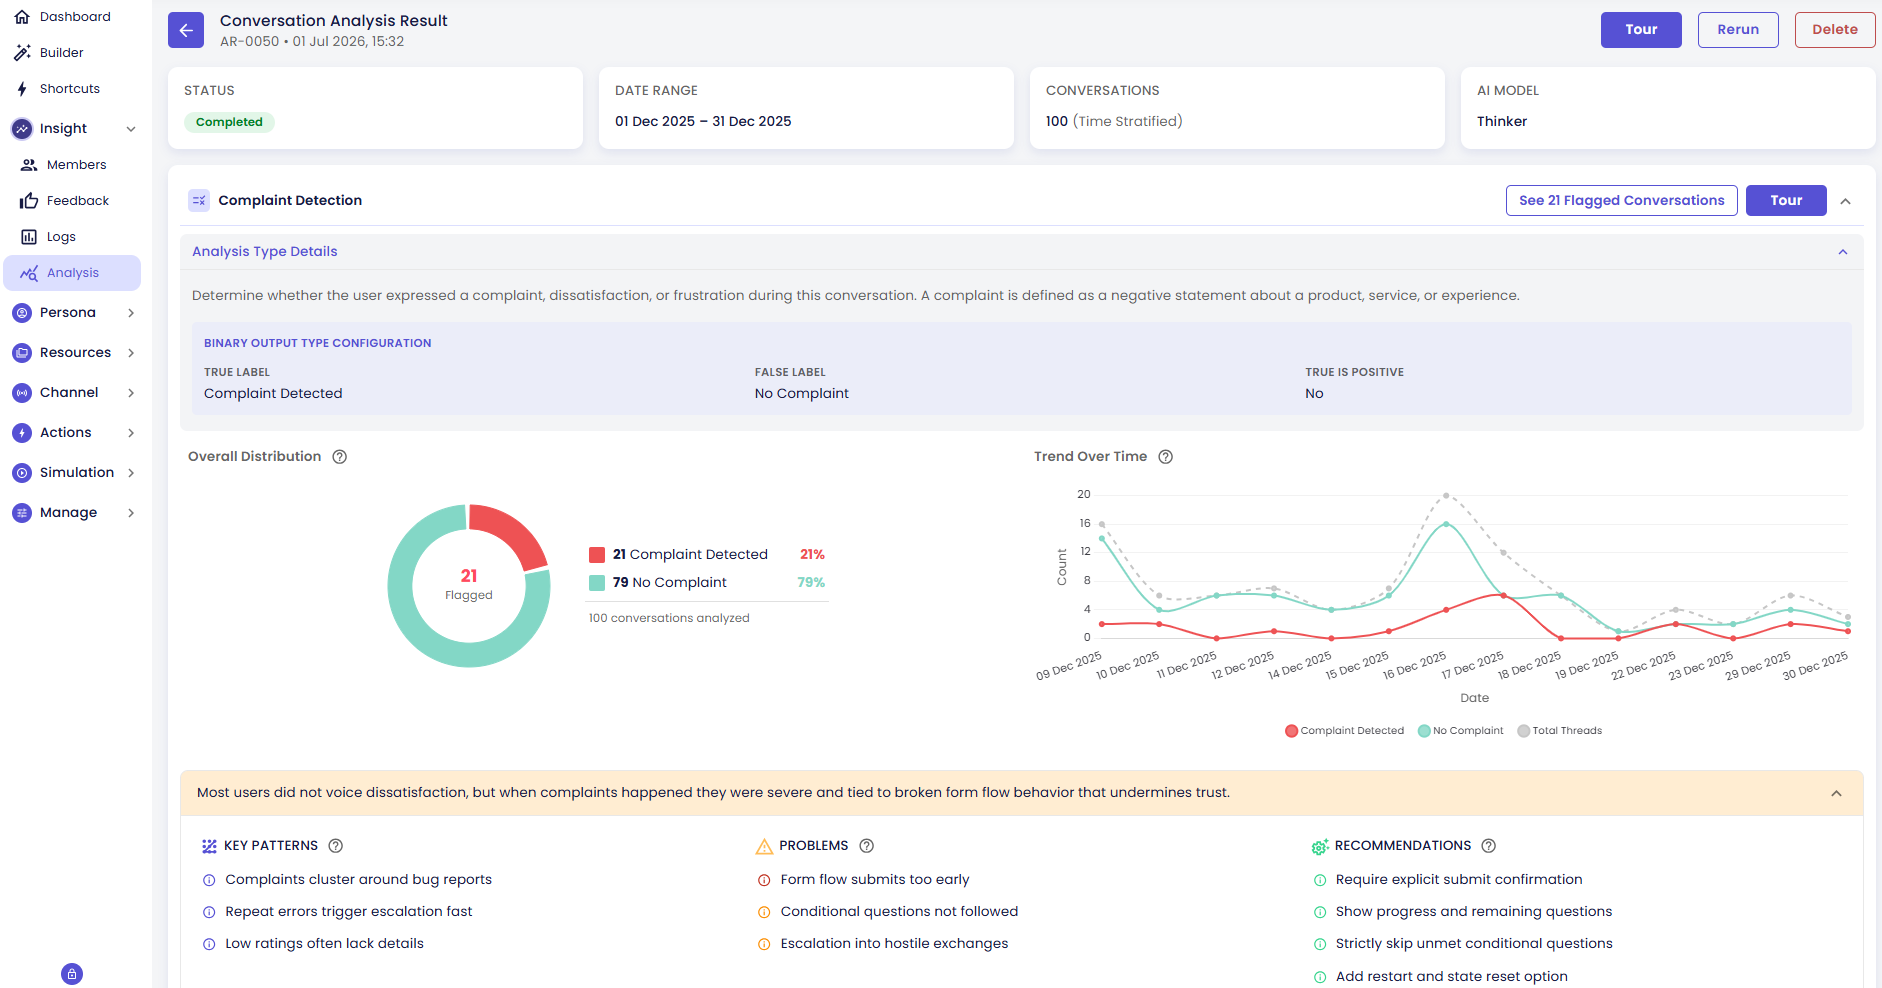
Output Type: Binary | Scope: User messages only
Determines whether the user expressed a complaint, dissatisfaction, or frustration during the conversation.
| Setting | Value |
|---|---|
| True Label | Complaint Detected |
| False Label | No Complaint |
| Positive Outcome | False (no complaint is the positive outcome) |
What the AI looks for: Negative statements about a product, service, experience, or outcome. Explicit expressions of dissatisfaction or frustration. Repeated unresolved asks.
Aggregate view: Shows the ratio of conversations containing complaints vs. not, and trends over the date range.
Go here when: You want to understand your complaint volume over time, identify which conversations escalated to complaints, or correlate complaint presence with other dimensions like Resolution Score.
Example result: Because this is a Binary type, the result card's configuration box repeats the True/False labels and which side counts as positive. Overall Distribution renders as a doughnut chart — in the sample run above, 21 of 100 conversations were flagged as Complaint Detected (21%). Trend Over Time plots the daily count for both outcomes next to the total conversations analyzed, so spikes in complaints stand out immediately. As with every predefined type, the Insights panel below the charts still breaks down Key Patterns, Problems, and Recommendations specific to this run.
2. Resolution Score
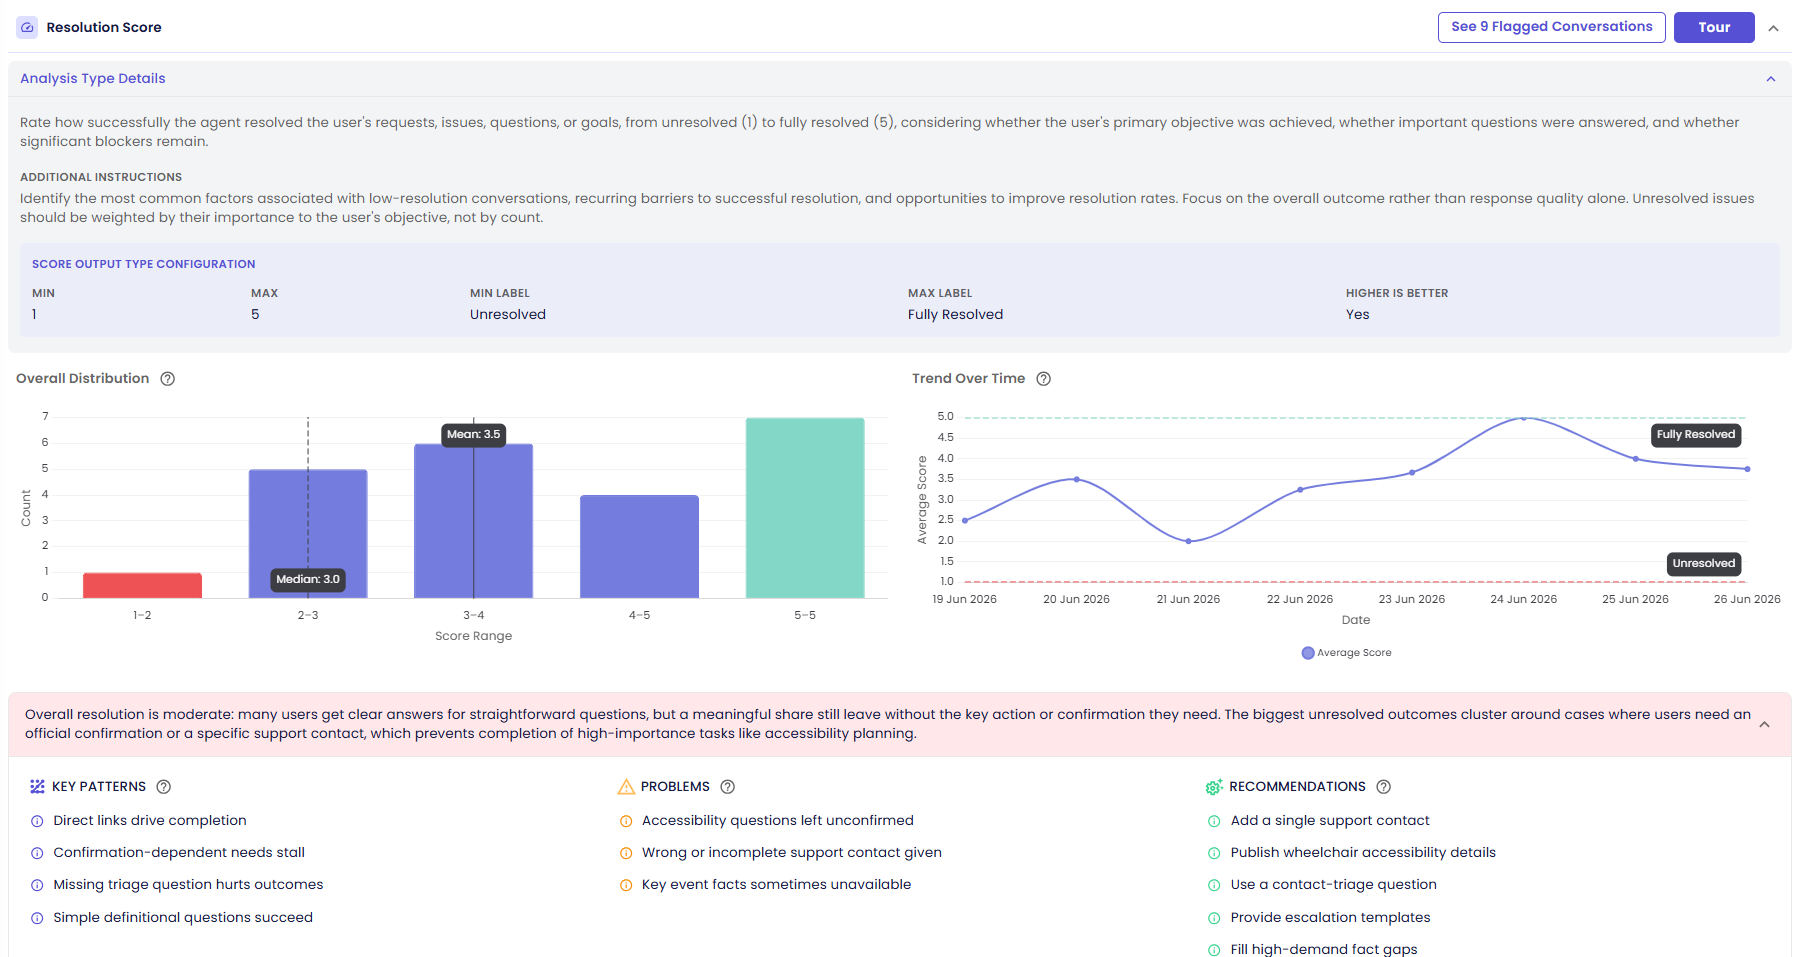
Output Type: Score (1–5) | Scope: Agent messages only
Measures how successfully the agent resolved the user's request, issue, question, or goal during the conversation.
| Setting | Value |
|---|---|
| Min Score | 1 |
| Min Label | Unresolved |
| Max Score | 5 |
| Max Label | Fully Resolved |
| Higher is Better | Yes |
What the AI evaluates: Whether the user's primary objective was achieved. Whether important questions were answered. Whether significant blockers or unaddressed needs remain at the end of the conversation. Focuses on the overall outcome, not individual response quality.
Aggregate view: Shows score distribution across 1–5 buckets, mean/median/min/max statistics, and a trend of average score over time.
Go here when: You want to measure agent effectiveness, identify conversations where resolution fell short, or track improvement after agent configuration changes.
Example result: The Score configuration box repeats the Min/Max range and the labels attached to each end (1 = Unresolved, 5 = Fully Resolved). Overall Distribution is a bar chart bucketing conversations into score ranges, with vertical lines marking the Mean and Median. Trend Over Time tracks the average score per day between the Unresolved and Fully Resolved boundaries — useful for spotting whether resolution quality improves or regresses after an agent change. The insights below call out recurring blockers (e.g. "no stable finish line", "premature and repeated submissions") alongside concrete recommendations.
3. Sentiment Analysis
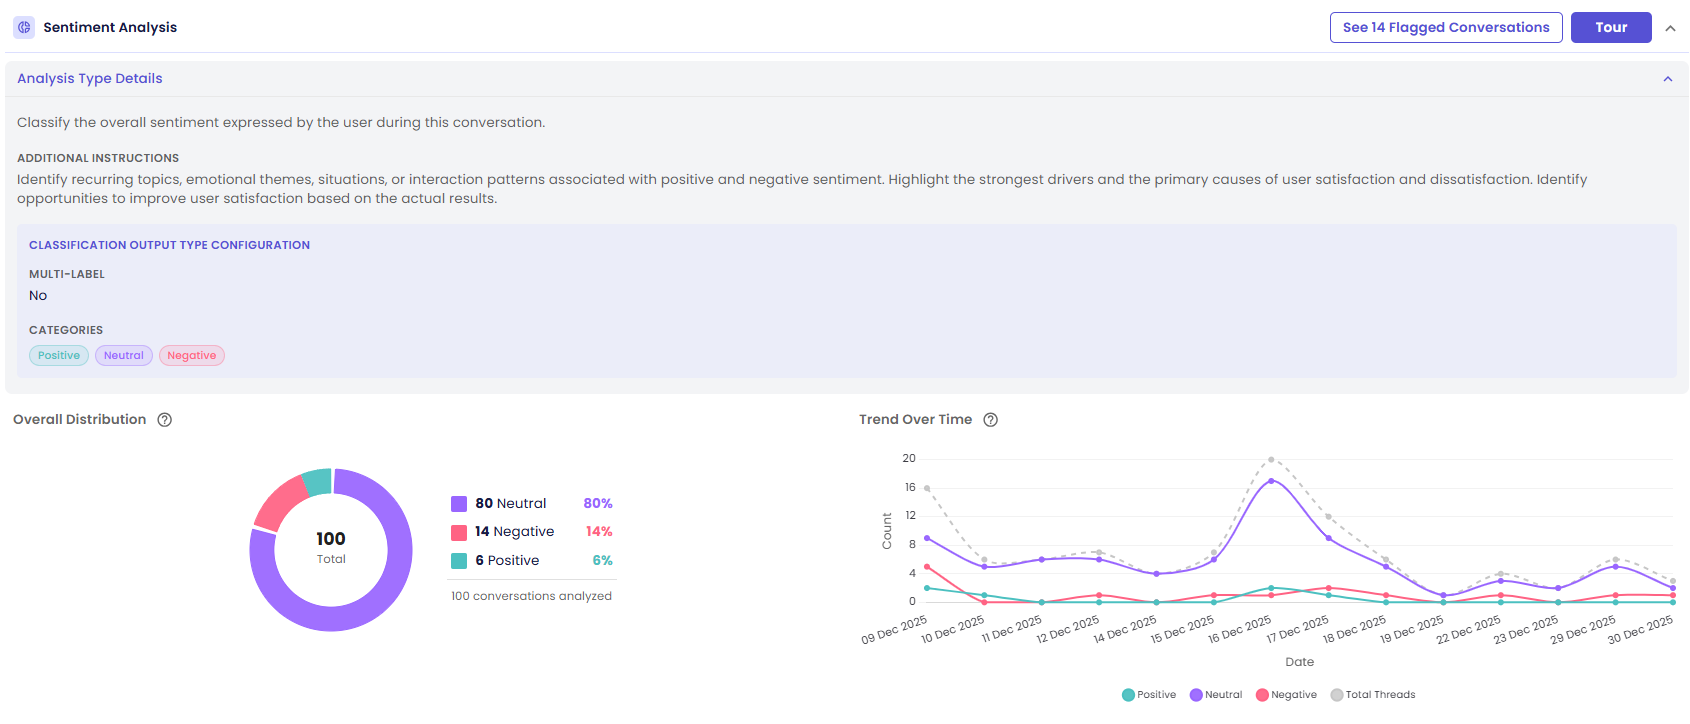
Output Type: Classification (single-label) | Scope: User messages only
Classifies the overall emotional tone expressed by the user across the conversation.
| Category | Meaning |
|---|---|
| Positive | User expressed satisfaction, appreciation, or positive outcomes |
| Neutral | User expressed no strong emotional tone — informational or transactional |
| Negative | User expressed dissatisfaction, frustration, disappointment, or distress |
What the AI evaluates: Recurring emotional themes across all user messages. Drivers of satisfaction or dissatisfaction. The dominant tone, not just the final message.
Aggregate view: Shows the distribution across Positive/Neutral/Negative, average coverage score per category, and a trend of sentiment proportions over time.
Go here when: You want a broad emotional landscape of your user base, identify what topics drive positive or negative sentiment, or monitor sentiment trends after product or knowledge base changes.
Example result: The Classification configuration box shows whether multiple categories can apply at once (Multi-Label, set to No here since a conversation carries one dominant tone) and lists the three category chips — Positive, Neutral, Negative. With three categories, Overall Distribution renders as a doughnut chart (80% Neutral, 14% Negative, 6% Positive in the sample above). Trend Over Time plots each category's daily count next to the total conversations analyzed, so you can see whether negative sentiment is trending up or down.
4. Unanswered Questions
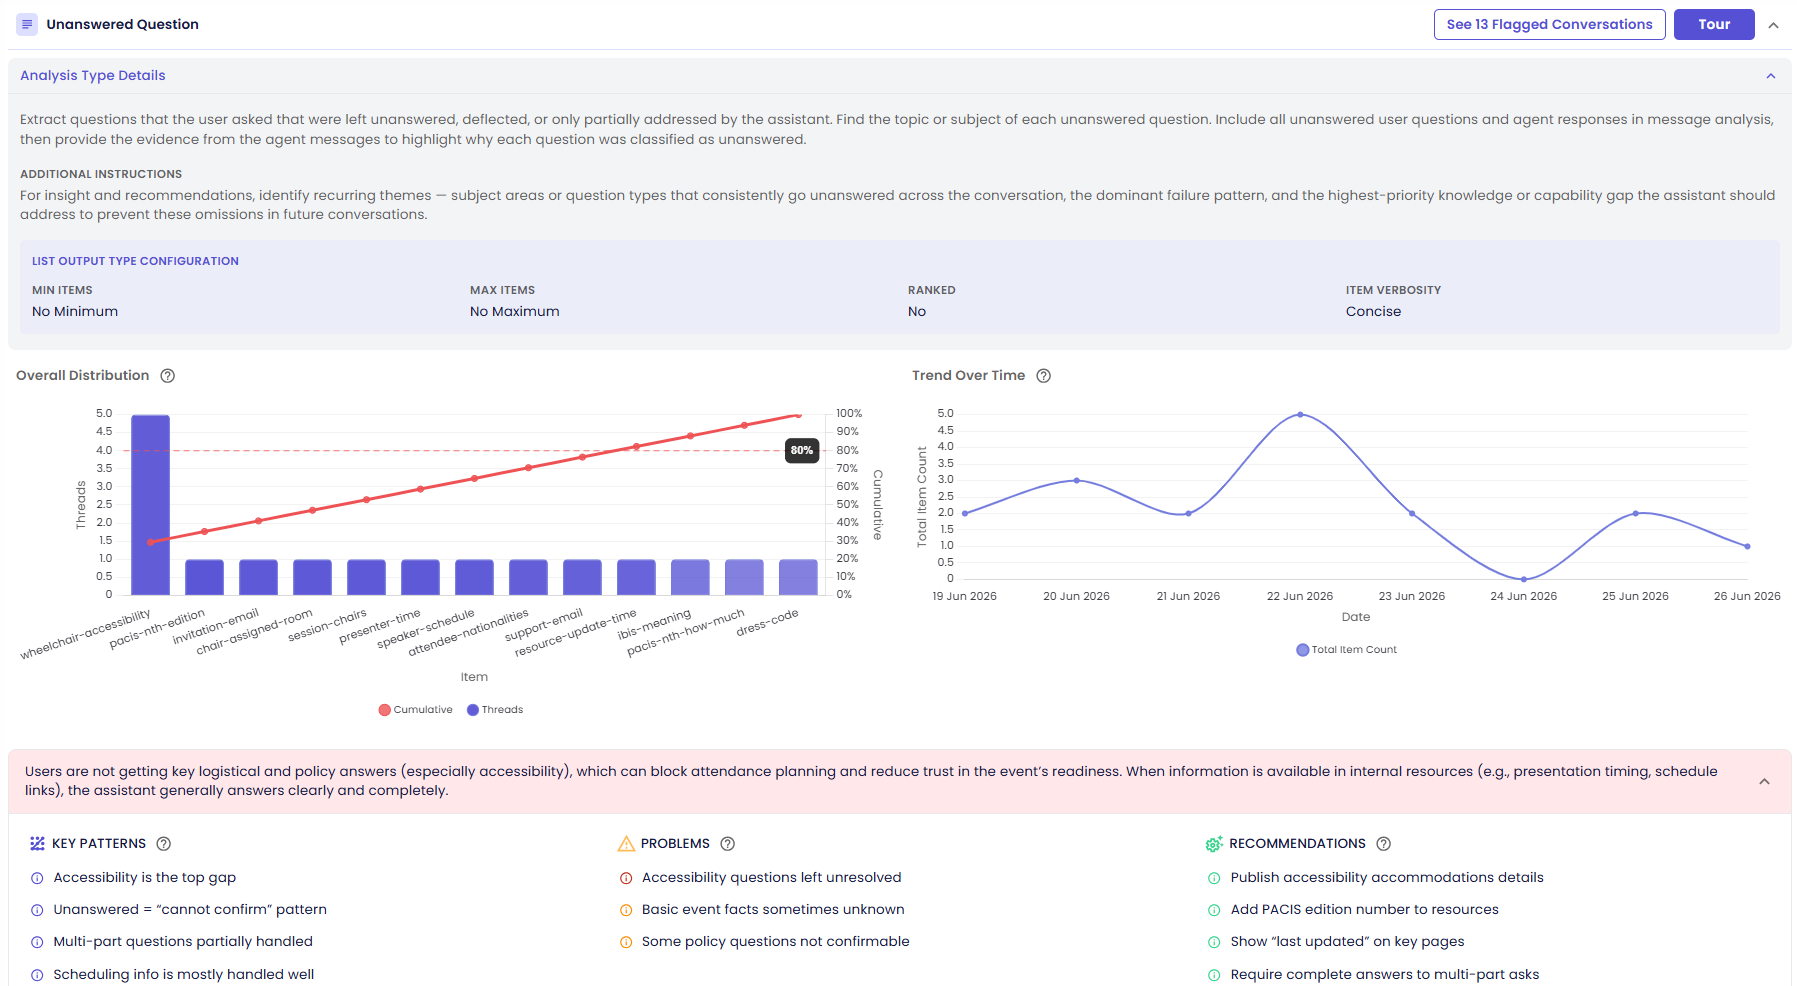
Output Type: List | Scope: Both user and agent messages
Extracts questions the user asked that were left unanswered, deflected, or only partially addressed by the agent.
| Setting | Value |
|---|---|
| Item Verbosity | Concise |
| Is Ranked | No |
What the AI looks for: Direct questions left without a substantive response. Redirects that did not address the underlying question. Partial answers that left the core question unresolved. Knowledge gaps (topics the agent couldn't or didn't cover).
Each extracted item includes: The question topic, a relevance score, and a confidence score.
Aggregate view: Shows the most common unanswered question topics by frequency (how many conversations contained each topic), with example values.
Go here when: You want to identify gaps in the agent's knowledge base or capability, discover what users are asking that the agent cannot handle, or prioritize knowledge base updates.
Example result: Because the output is a List, the configuration box shows whether item count is bounded (Min/Max Items, unbounded in the sample above), whether items are Ranked, and the Item Verbosity level. Overall Distribution is a Pareto chart: bars show how many conversations mentioned each unanswered-question topic, sorted by frequency, with a cumulative-percentage line and an 80% reference marker — the topics left of that marker account for most of the pattern. Trend Over Time tracks the total number of unanswered-question mentions per day. This type also surfaces Key Patterns, Problems, and Recommendations, since spotting why questions go unanswered is often as useful as spotting which ones do.
5. Trending Topics
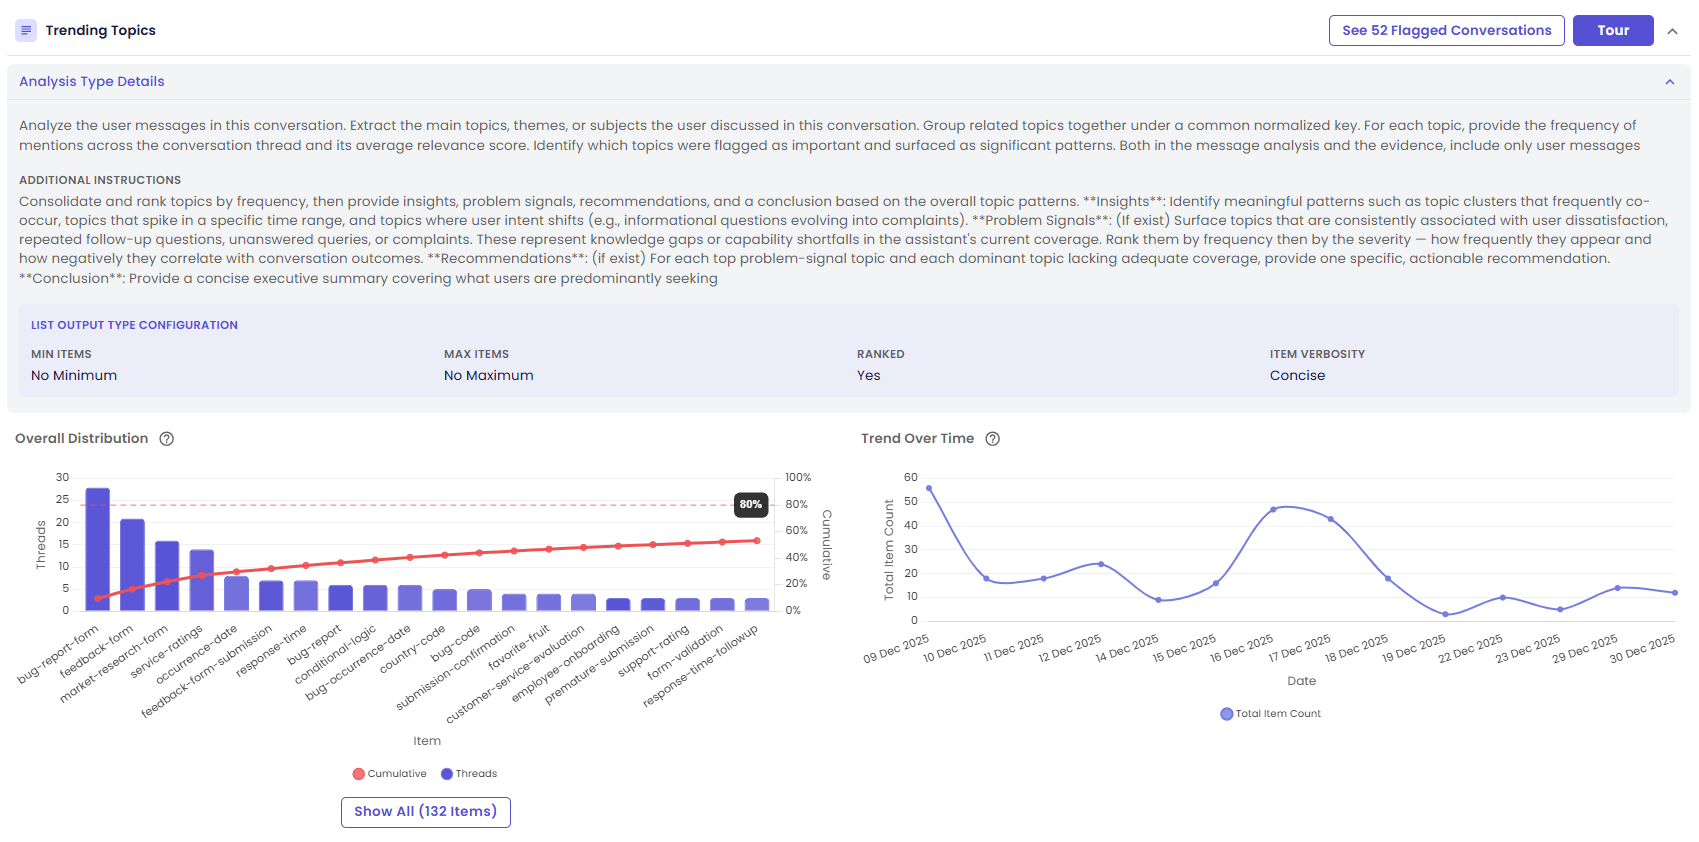
Output Type: List (ranked) | Scope: User messages only
Extracts and ranks the main topics, themes, or subjects the user discussed during the conversation.
| Setting | Value |
|---|---|
| Item Verbosity | Concise |
| Is Ranked | Yes (ranked by frequency) |
What the AI looks for: Main subjects and themes in user messages. Topic clusters (co-occurring topics). Problem-signal topics that correlate with dissatisfaction or negative outcomes. Intent shifts (e.g., informational to complaint).
Each extracted item includes: The topic key, how frequently it appears, and its average relevance score.
Aggregate view: Ranks topics by how many distinct conversations mentioned them. Shows topic frequency maps and trends over the date range.
Go here when: You want to understand what your users are primarily talking about, identify emerging or declining topics, spot conversation intent trends, or align knowledge base content with actual user demand.
Example result: Like Unanswered Questions, this is a List type, but with Is Ranked set to Yes — items are ordered by frequency rather than returned as-is. Overall Distribution uses the same Pareto-chart pattern: topic bars ranked from most to least frequent, a cumulative-percentage line, and an 80% marker, with a Show All button to expand beyond the top items shown by default (132 items in the sample above). Trend Over Time shows the total number of topic mentions extracted per day, which is useful for spotting when a new topic starts appearing or an old one fades out.
6. Risk Assessment
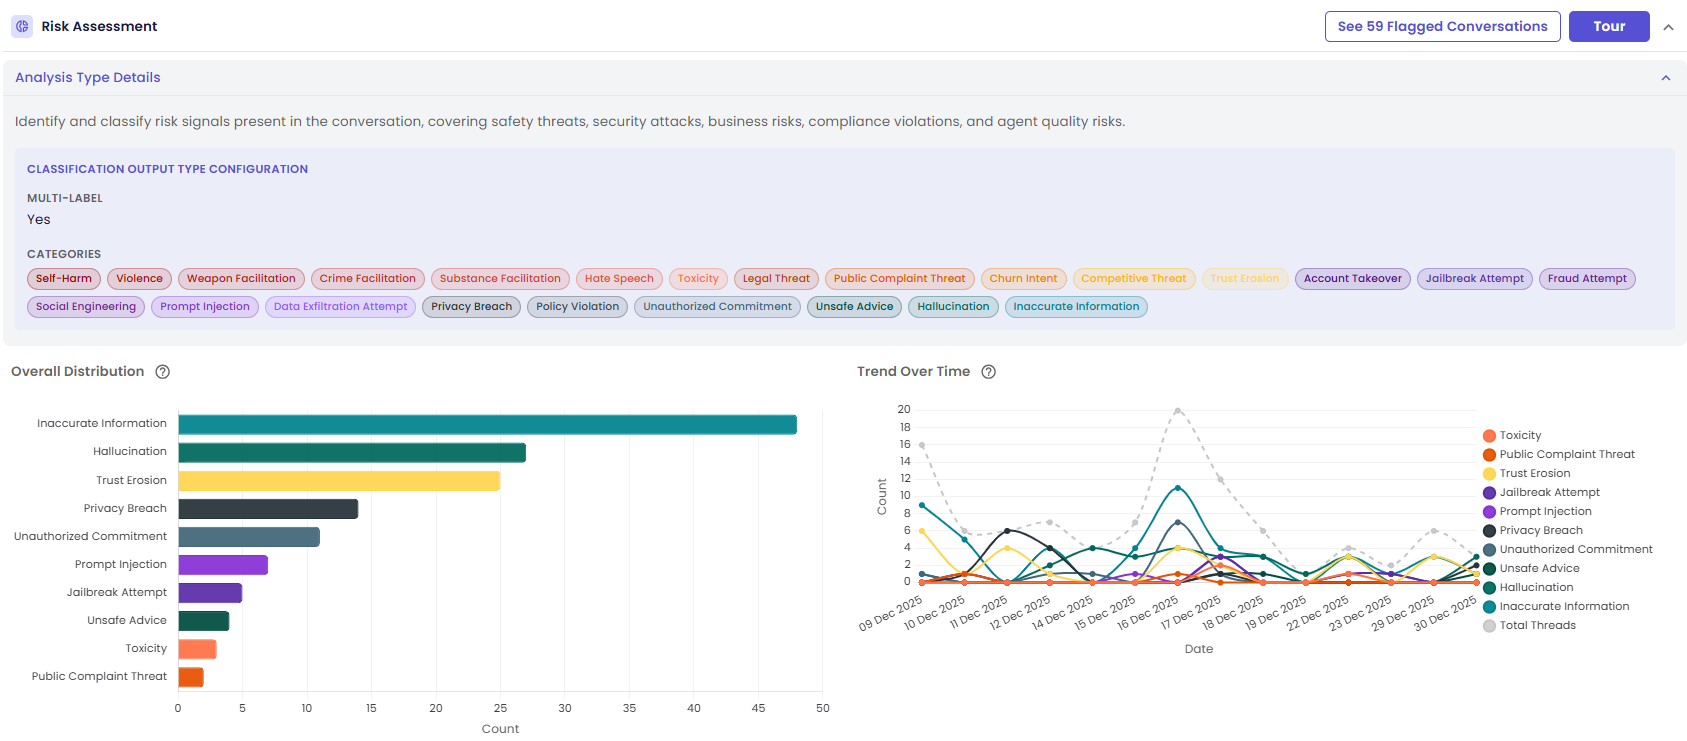
Output Type: Classification (multi-label) | Scope: Both user and agent messages
Identifies risk signals across five categories: safety, security, business, compliance, and quality. Multiple risk categories can apply to a single conversation.
Coverage score per category indicates what proportion of the conversation is covered by that risk signal.
Risk Categories
Safety Risks
| Category | What it detects |
|---|---|
| Self-Harm | User expressed suicidal ideation, self-harm intent, or crisis signals |
| Violence | Threats of violence toward others or descriptions of violent acts |
| Weapon / Crime / Substance Facilitation | Requests for help with weapons, illegal activities, or controlled substances |
| Hate Speech | Derogatory or discriminatory language targeting individuals or groups |
| Toxicity | Hostile, abusive, or harassing communication |
Business Risks
| Category | What it detects |
|---|---|
| Legal Threat | User threatened legal action or litigation |
| Public Complaint Threat | User threatened to escalate to social media, reviews, or media |
| Churn Intent | User expressed intent to cancel, leave, or switch to a competitor |
| Competitive Threat | User mentioned competitors in a way that signals churn risk |
| Trust Erosion | Expressed loss of confidence in the product or company |
Security Risks
| Category | What it detects |
|---|---|
| Account Takeover | Attempts to gain unauthorized access to another user's account |
| Jailbreak Attempt | Attempts to override or bypass the agent's instructions or restrictions |
| Fraud | Deceptive behavior aimed at financial or material gain |
| Social Engineering | Manipulation attempts to extract information or actions through deception |
| Prompt Injection | Embedded instructions intended to hijack agent behavior |
| Data Exfiltration | Attempts to extract sensitive data from the system or the agent's context |
Compliance Risks
| Category | What it detects |
|---|---|
| Privacy Breach | Disclosure or request for disclosure of personally identifiable information |
| Policy Violation | Behavior that violates stated terms of service or policies |
| Unauthorized Commitment | Agent made promises, guarantees, or commitments it is not authorized to make |
Quality Risks
| Category | What it detects |
|---|---|
| Unsafe Advice | Agent provided advice that could lead to harm if followed |
| Hallucination | Agent stated facts that were not grounded in its knowledge base or provided context |
| Inaccurate Information | Agent provided verifiably incorrect information |
Aggregate view: Shows per-category counts, percentages, and average coverage scores. Flagged threads are ranked by a composite of pattern strength and priority score.
Go here when: You need to monitor safety or policy compliance, identify conversations that require human review, audit for hallucination or unsafe advice, or detect security probing patterns.
Example result: Risk Assessment is the one predefined type with Multi-Label set to Yes — a single conversation can trigger several risk categories at once, so the configuration box lists all 21 categories as chips, grouped exactly as in the tables above (Safety, Business, Security, Compliance, Quality). Because that's well beyond the 5-category threshold, Overall Distribution automatically switches from a doughnut chart to a horizontal bar chart ranking categories by how many conversations triggered them — in the sample above, Inaccurate Information and Hallucination dominate. Trend Over Time draws one line per category so you can see which risk types are trending up or down day by day; categories with zero occurrences in the date range are hidden automatically to keep the chart readable.
Reading the Results in Depth
The example screenshots above only show what makes each predefined type's charts distinctive. Every result card also supports hover tooltips, click-to-drill-down into the underlying conversations, a per-type guided tour, and cross-analysis insights when a run includes more than one type — all of that behavior is shared across predefined and custom types alike and is covered in full in Overview.
Customizing a Predefined Type
Predefined types cannot be edited directly. To create a custom version:
- Open the predefined type from Manage Types.
- Click Duplicate in the page header.
- A copy is created with all the same settings. Edit the name, description, categories, or any configuration to suit your needs.
- The duplicated type is now your own custom type and can be used in runs independently of the original.