Guided Tour & Help
Open in CMSThe Overview tab can be dense — charts, insights, flagged conversations, multiple analysis types on one screen. To make sense of it without reading a manual, there's a built-in guided tour, plus quick-access info popovers for when you just need one answer and don't want to click through steps.
First Visit: The Tour Prompt
The first time you open a completed run's Overview tab, a snackbar appears at the top offering to start the tour:

Click Start Tour to begin, or dismiss it with the ✕ — it also disappears on its own after 12 seconds if you don't interact with it. It only shows up once; after that, you can still start a tour manually any time (see below).
The High-Level Tour
This is the "orientation" tour — it walks through the page as a whole rather than any one analysis type in detail. Trigger it manually with the Tour button next to Rerun/Delete at the top of the page:
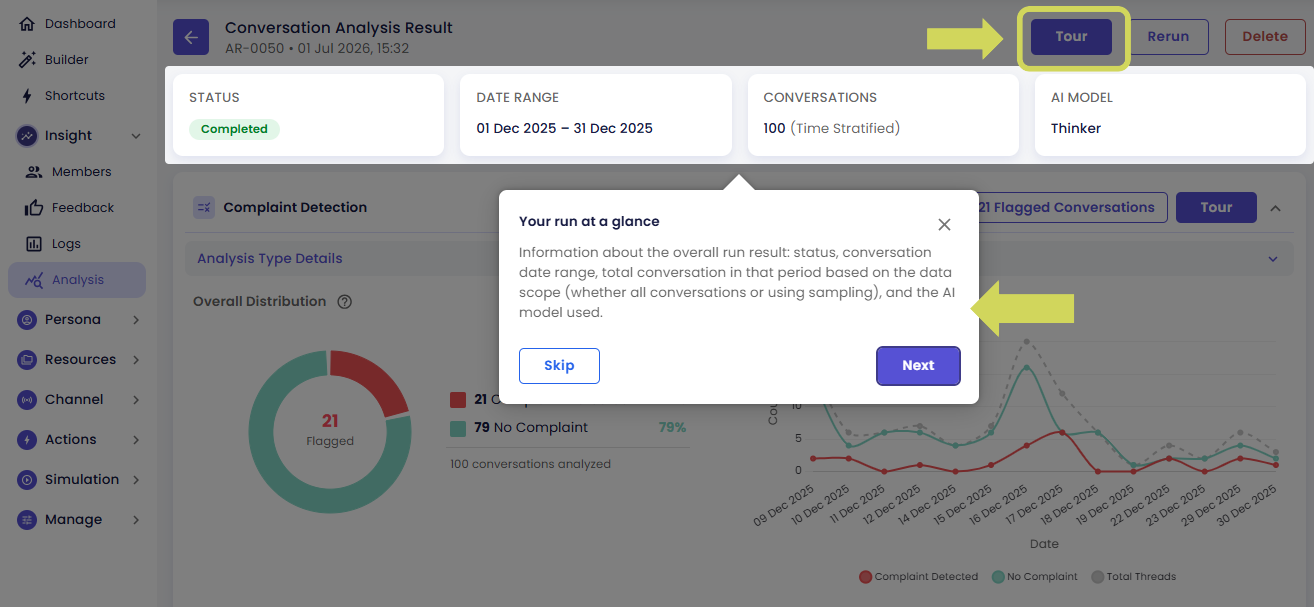
It covers, in order:
- The run summary card (status, date range, conversations, AI model)
- The Overall Insights card, if the run has two or more analysis types — its conclusion banner and the Key Patterns / Problems / Recommendations sections
- The first result card as an example — its header, its aggregate chart, its trend chart (if that type has one), and its Flagged Conversations button (if it has flagged items)
It's meant to be a quick, one-time orientation — not a deep dive into every analysis type.
Continue Deeper, or Stop There
When the high-level tour finishes, you're asked whether you want to go further:
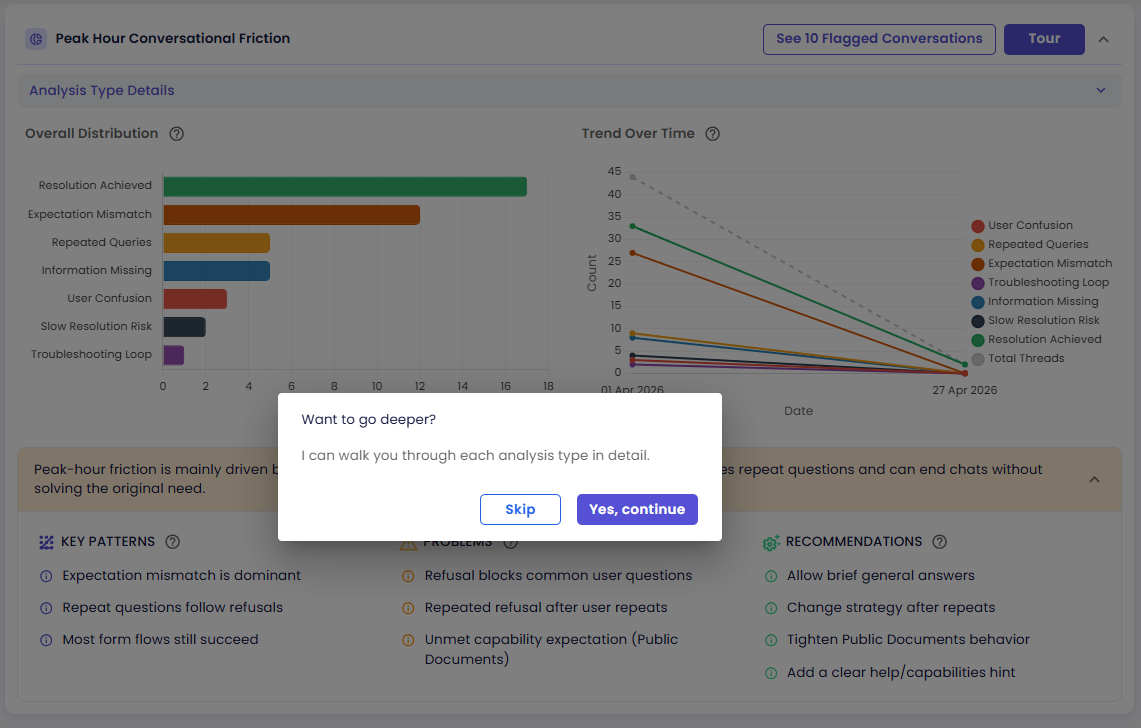
- Skip — end the tour here, you've seen the overview
- Yes, continue — move into a detailed, type-by-type walkthrough (see below)
Overall Insights Tour
If you just want to understand the cross-analysis insights card on its own, click the Tour button in the Overall Insights header:
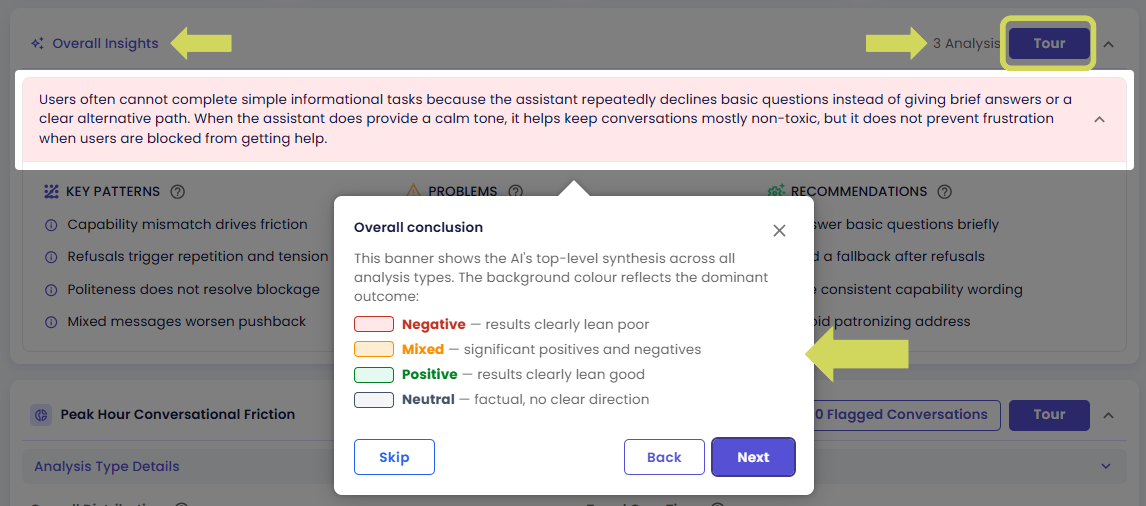
This walkthrough explains the conclusion banner and its color coding, then each of the Key Patterns, Problems, and Recommendations sections. Full details are on the Overall Insights page.
Per-Analysis-Type Tour
Each result card has its own Tour button in its header:
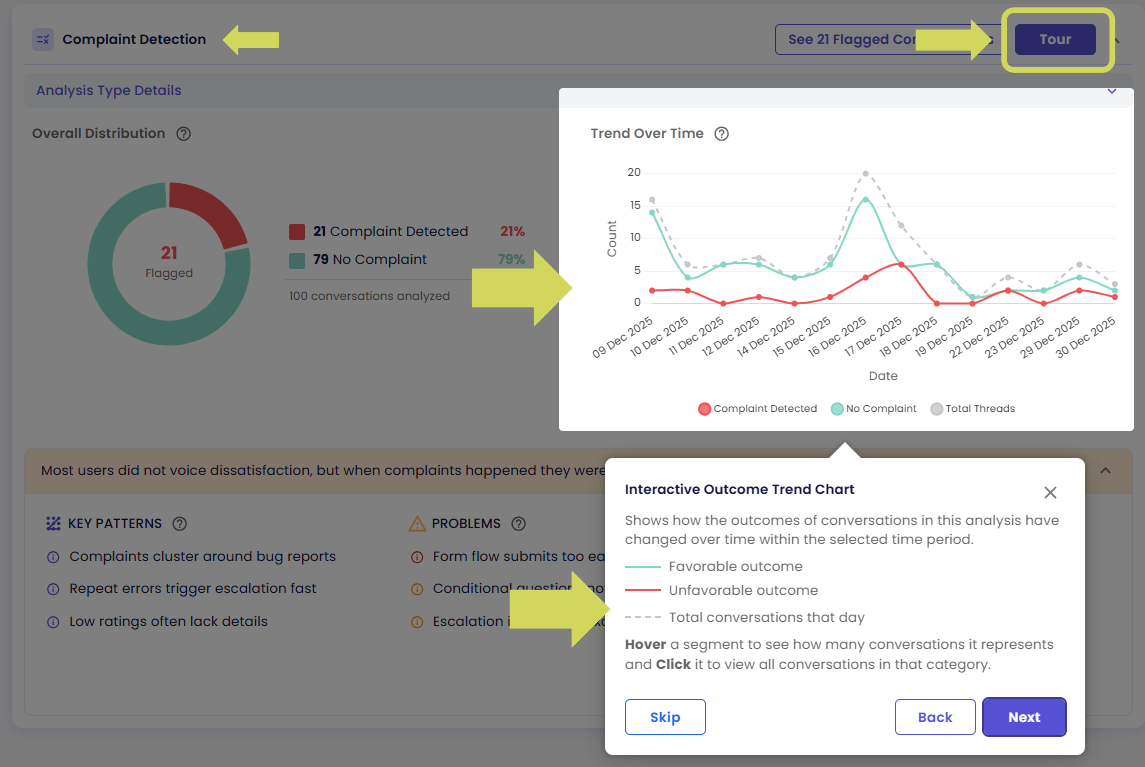
This tour adapts to the analysis type it belongs to — the steps and explanations match whatever charts that specific type actually shows. A Score-type card gets a tour explaining its distribution and average-score trend chart; a Classification-type card gets one explaining category distribution and per-category trend lines; and so on for Yes/No Charts (Binary) and Extracted Item Charts (List).
Skip the Steps: Info Popovers
If you don't want to step through a tour, every section that a tour would explain also has a ⓘ info icon next to its heading (e.g. next to "Overall Distribution" or "Trend Over Time"). Clicking it opens the same explanation instantly, in place, without starting a multi-step walkthrough:
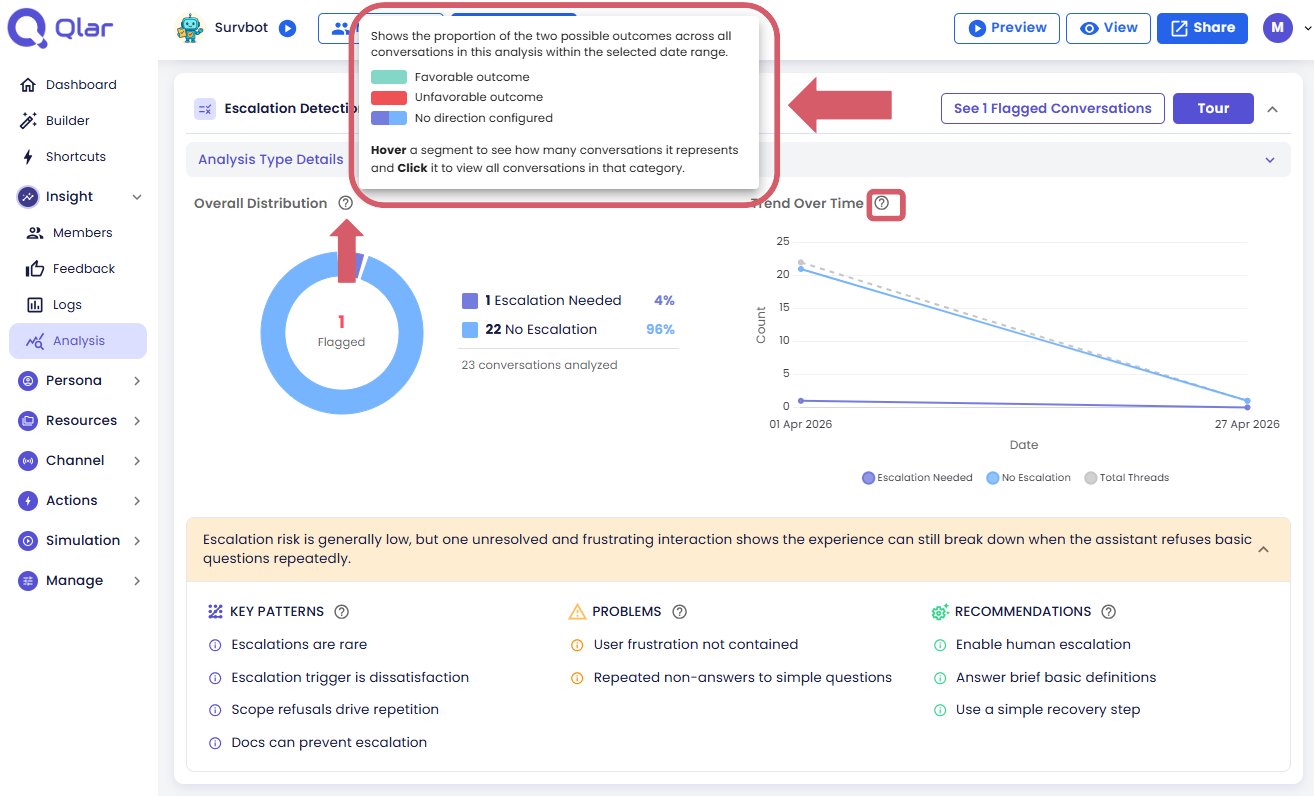
Use this when you just need a reminder about one specific chart or section, and the full tour for that card, e.g. when reading a run someone else created.
Where to Find Each Trigger
| Trigger | Location | Starts |
|---|---|---|
| Snackbar | Bottom of the page, first visit only | High-level tour |
| Tour button | Top of the page, next to Rerun/Delete | High-level tour |
| Tour button | Overall Insights card header | Overall Insights tour |
| Tour button | Each result card header | That card's per-type tour |
| ⓘ icon | Next to any chart or section heading | An instant popover for just that section |
Next Steps
- Overall Insights
- Viewing the Conversations Behind a Chart
- Yes/No Charts (Binary)
- Score Charts
- Category Charts (Classification)
- Extracted Item Charts (List)