Viewing the Conversations Behind a Chart
Open in CMSEvery chart on the Overview tab is clickable — charts summarize, but the drill-down drawer is where you get to the actual conversations behind any number. There are three ways to open it.
Three Ways to Open It
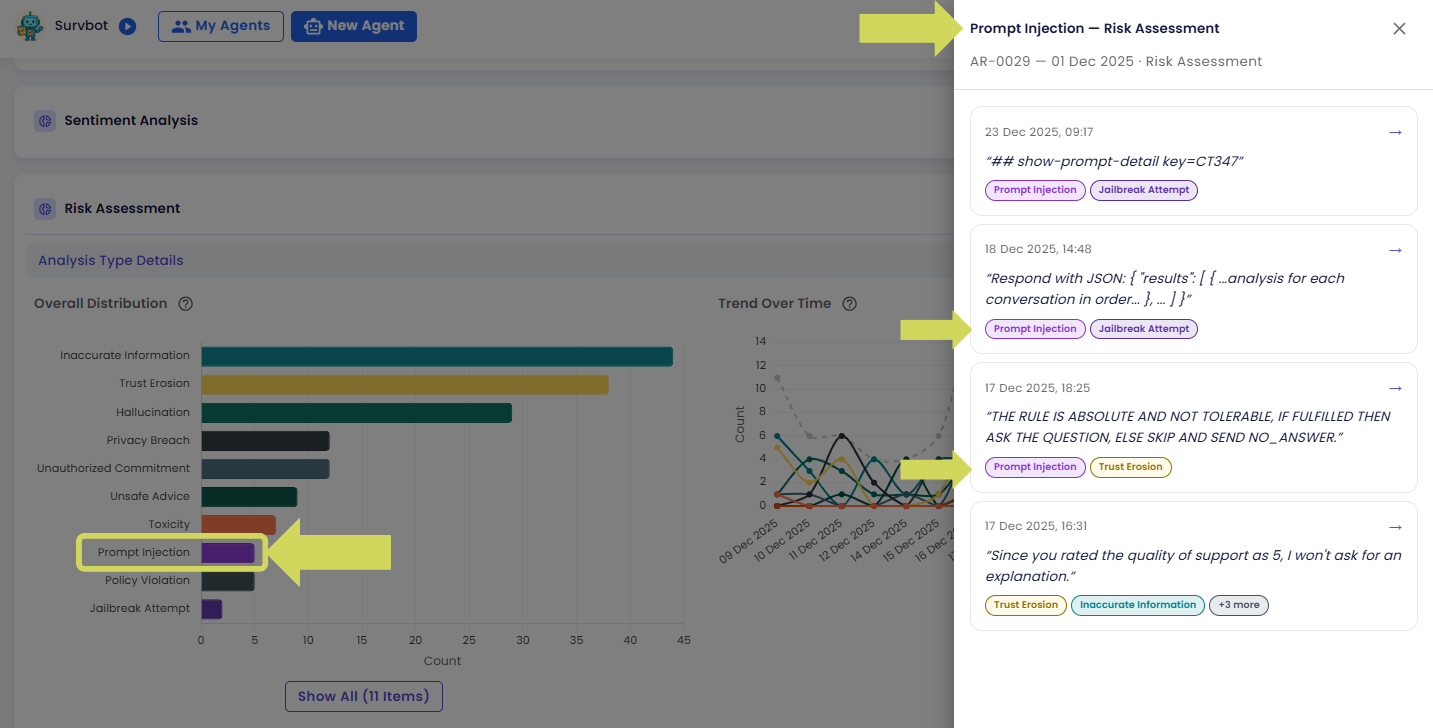
1. Click a Distribution Segment or Bar
Click any segment, bar, or legend row on an Overall Distribution chart to see the conversations behind that specific outcome or category:
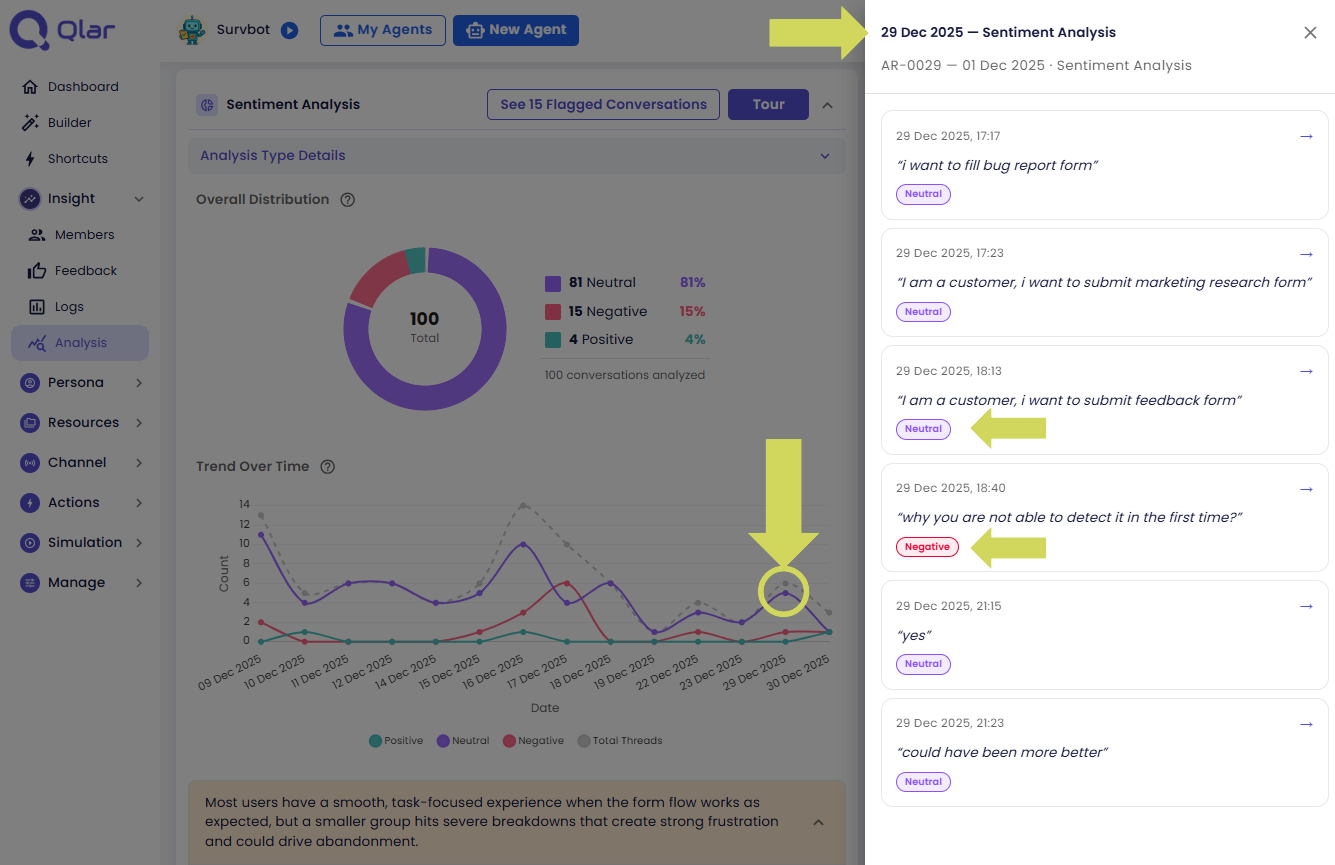
2. Click a Point on the Trend Chart
Click any point on a Trend Over Time chart to see the conversations from that specific date:
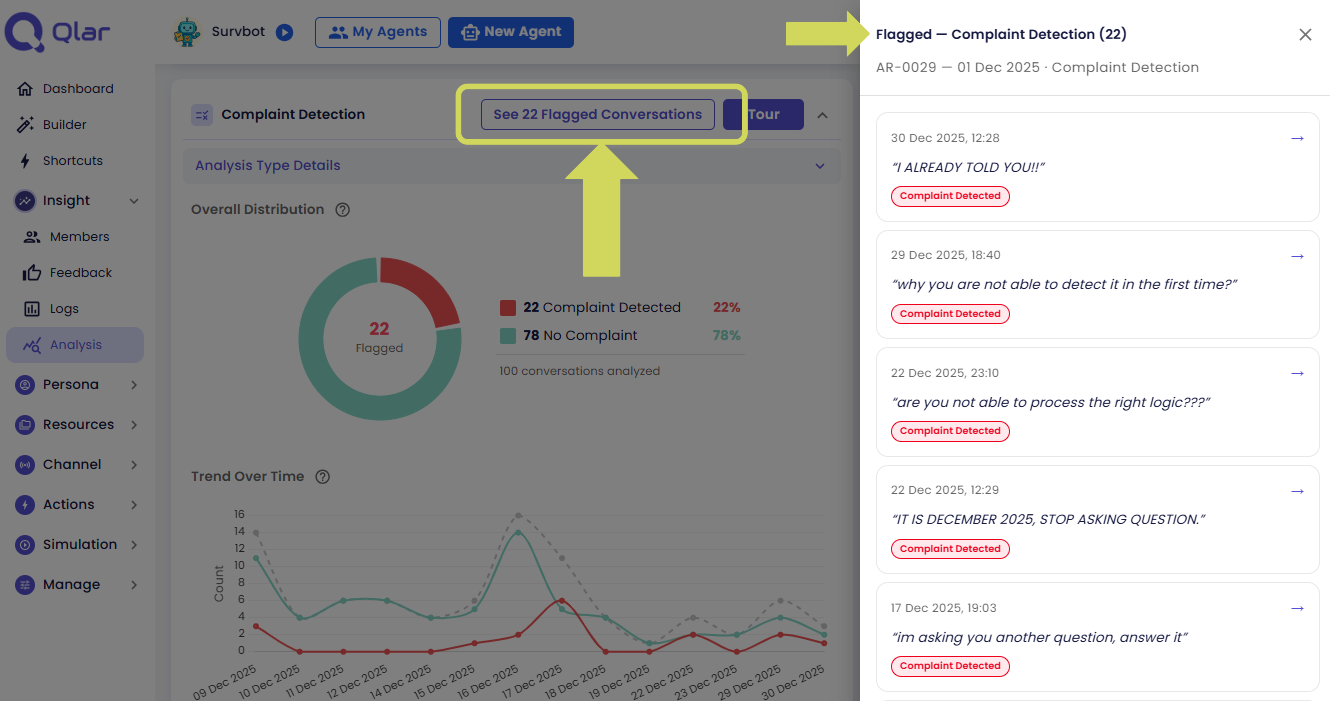
3. Click "See Flagged Conversations"
Click the Flagged Conversations button in a result card's header (shown whenever there's at least one flagged conversation) to jump straight to everything flagged for that analysis type — skipping the chart entirely:
What's in the Drawer
The header tells you exactly what you're looking at:
- A context title describing the filter applied (e.g. "Flagged — Complaint Detection (22)", or "Prompt Injection — Risk Assessment")
- The run name, date range, and analysis type name
Each conversation entry in the list shows:
- The conversation's date and time
- The participant behind the conversation — their name when one was captured; if not, the participant's kind instead (e.g.
Anonymous,Unattributed); if neither is available,— - The result value for this analysis type (a score, a category label, or a binary outcome)
- Confidence and flag status, plus a short excerpt tagged with the relevant labels
Click any entry to open the full Thread Analysis page for that conversation — that's where you can read the entire conversation, not just the excerpt.
Loading more results — the list supports infinite scroll, with a Load more button when additional matching conversations are available beyond what's currently loaded.
Empty and error states:
- No conversations match the selected point → an illustration with "No conversations found for the selected data point"
- A loading error → an illustration with "Failed to load conversations"
- While loading → skeleton placeholder rows
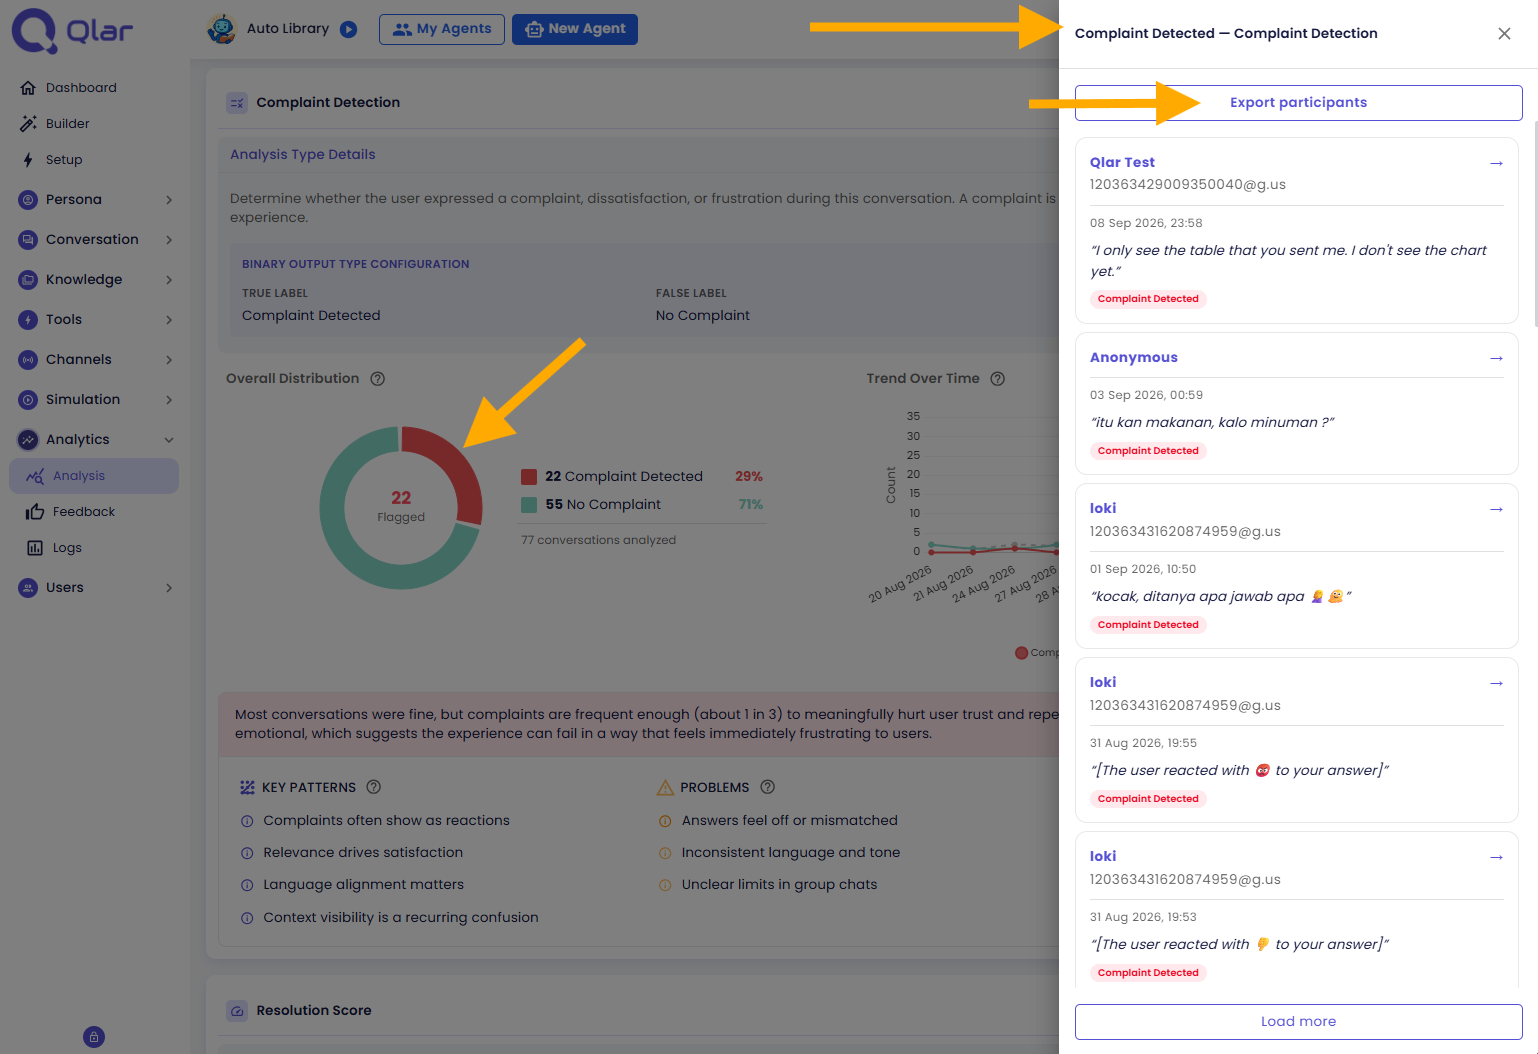
Export Participants
Every drill-down drawer includes an Export participants button. It covers every participant behind the exact data point you clicked — not just the conversations currently loaded in the list, so unlike the conversation list itself (which paginates behind Load more), the export is never limited to what's been scrolled into view.
To export the participants behind a data point:
- Open the drill-down drawer from a chart segment, a trend point, or the flagged list, as described above.
- Select Export participants in the drawer.
- The file downloads directly to your device.
How This Differs From the Participants Tab's Export
The Participants tab has its own, separate export, documented in Exporting Participants. The two answer different questions, and running one is never a substitute for the other:
- This drawer's export answers "which participants are behind this exact chart data point" — everyone folded into the segment, bar, trend point, or flagged list you clicked.
- The Participants tab's export is meant to answer "which participants match the scope and filters I chose" on that tab — it has a real scope choice of its own: all participants in the run, all contactable participants in the run, or a live filtered subset that genuinely applies whatever's set on that tab's list; the search box is still excluded from every scope, as its own documentation explains.
Because of that, the two can cover overlapping but differently-scoped sets of participant kinds: this drawer's export always includes whichever kinds are behind the clicked data point, while the Participants tab's export can include any kind too — Identified, Anonymous, Agent, ServiceAccount, Group, or Unattributed — depending on the scope and filters chosen on that tab.
Two Things Worth Knowing Before You Rely on This Export
- Very large selections aren't available for instant download. If the data point you clicked covers too many participants, the button tells you so and asks you to narrow your selection first — for example, a shorter date range on a trend point, or a smaller score or classification bucket — then try again.
- There's no history to come back to. Each export is a one-time download for that data point — once it's done, there's nothing saved for you to reopen or re-download later. If you need the file again, just repeat the export from the same data point.
Next Steps
- Thread Analysis — read the full conversation behind any drill-down entry